Wed Mar 27 2024
Methods in pre and post analysis
Signicicant Differences to corelation
ANOVA with Tukey’s post-hoc test
In this paper, Tukey’s post-hoc test (two-tailed) was used for intra- and inter-group comparisons of the bioclinical parameters and inflammatory markers.
The Two-way repeated measures analysis of variance (ANOVA) with Tukey’s post-hoc test (two-tailed) is a statistical method used to analyze the effects of two or more independent variables on a dependent variable, where the measurements on the dependent variable are taken multiple times. This approach is particularly useful in experiments where the same subjects are exposed to different conditions or measured at different times. Here's a breakdown of the components of this method.
Refer to:
- https://www.statisticshowto.com/probability-and-statistics/statistics-definitions/post-hoc/tukey-test-honest-significant-difference/
- https://en.wikipedia.org/wiki/Bland–Altman_plot
- https://biostats.w.uib.no/post-hoc-tests-tukey-hsd/
Tukey’s Honest Significant Difference (HSD) test is a post hoc test commonly used to assess the significance of differences between pairs of group means. Tukey HSD is often a follow up to one-way ANOVA, when the F-test has revealed the existence of a significant difference between some of the tested groups. Running the test in R involves using the function TukeyHSD() which does not require any additional package installation.
Step 4: Find the critical value in The Q table. For this, you’ll need k, which is the number of groups or treatments and degrees of freedom for the error term.
Step 4: Calculate the HSD statistic for the Tukey test using the formula:
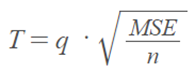
You’ll get MSE from the Anova output (MS error term); “n” is the number of items in one sample.
Step 5: Compare the score you calculated in Step 3 with the tabulated value you found in Step 4. If the calculated value from Step 3 is bigger than the critical value from the Q table, the two means are significantly different.
The methods mentioned in the paper describe statistical tests used to analyze data in a study, particularly focusing on variations in gender, glycemic control (measured by HbA1c levels), and other participant characteristics. Here's a breakdown of each method mentioned:
Pearson Chi-Square Test
- Purpose: This test is used to analyze variations in categorical variables. In the context of this paper, it was specifically used to examine differences in gender distribution and the proportion of participants achieving adequate glycemic control (defined by an HbA1c level of 7.0% as the cut-off).
- How It Works: The Pearson Chi-square test compares the observed frequencies in each category to the frequencies expected if there were no association between the categories. It's a non-parametric test that doesn't assume a normal distribution of the data.
- Two-Tailed Test: The mention of a two-tailed test indicates that the researchers were looking for deviations in both directions from the hypothesized association, without a specific direction of interest beforehand.
Mann-Whitney U Test
- Purpose: This test is used to compare differences between two independent groups when the dependent variable is either ordinal or continuous but not normally distributed. In this paper, it was used to analyze variations in other participant characteristics at baseline.
- How It Works: The Mann-Whitney U test ranks all the values from both groups together, then compares the sums of ranks between the two groups. It's a non-parametric alternative to the independent samples t-test and does not assume normal distribution of the data.
- Two-Tailed Test: Similar to the Pearson Chi-square test, a two-tailed approach indicates looking for differences in any direction between the two groups.
Also called Wilcoxon rank sum test(Similar but not equaled to Wilcoxon signed rank test, which used in LEfSe), the Mann-Whitney U Test is another non-parametric test which don’t need for the data to obey Gaussian distribution.
Refer to:
- https://en.wikipedia.org/wiki/Mann–Whitney_U_test
- https://sphweb.bumc.bu.edu/otlt/mph-modules/bs/bs704_nonparametric/bs704_nonparametric4.html
Canopy-based algorithm
This is an unsupervised pre-clustering algorithm.
The Canopy algorithm is a fast clustering technique that is used for preliminary clustering of large-scale data. It requires only one pass through the data to obtain the results. However, it may not be accurate for large-scale data clustering. Therefore, it is often used in combination with other algorithms or model software for refinement. The algorithm works by dividing the data into Canopy sets based on certain criteria, such as distance or similarity. Each Canopy set has a center point. The number of Canopy sets can be used as a parameter for other clustering algorithms, such as K-means, to determine the number of clusters and initial cluster centers. This preprocessing step helps to speed up the clustering process and improve computational efficiency.
Refer to:
- https://en.wikipedia.org/wiki/Canopy_clustering_algorithm
- https://www.sciencedirect.com/science/article/abs/pii/S0950705118300479
Statistical Significance and Data Representation
- Statistical Significance: The paper considers a P value of less than 0.05 as statistically significant. This threshold indicates that the observed effects are unlikely to be due to chance alone.
- Absolute Values and Means ± S.E.M.s: Statistical analyses were performed using absolute values, and results were expressed as means ± standard error of the mean (S.E.M.). This suggests that the data were summarized in terms of average values with a measure of variability to indicate the precision of the mean estimate.
- Percentage Changes from Baseline: Data in the figures were presented as percentage changes from the baseline. This method of data visualization helps in understanding the relative changes over time or between groups, making it easier to visualize group and temporal differences.
These statistical methods and data presentation techniques are standard in research studies, especially in clinical and biomedical research, to assess differences between groups and changes over time in various measures.
Dummy Variables
Dummy variables, often referred to as indicator variables, are used in statistical models to represent categorical data. Since many statistical models require numerical input, categorical or nominal data like "gender" (male, female) or "color" (red, green, blue) cannot be directly inserted into these models. Dummy variables convert these categorical data into a format that can be provided to the models.
Here’s how it works:
- Representation: Each category of a nominal variable is represented by a dummy variable. For instance, if you have a variable for color with three categories (red, green, blue), you would create three dummy variables (let’s call them Color_Red, Color_Green, and Color_Blue).
- Binary Coding: Each dummy variable takes the value of 0 or 1. A value of 1 indicates the presence of the corresponding category, and 0 indicates absence. For example, if a given observation is "green", Color_Green would be 1, and Color_Red and Color_Blue would be 0.
- Avoiding the Dummy Variable Trap: When using dummy variables, one category is usually left out as the reference category. This is to avoid multicollinearity in the model, where the dummy variables are too highly correlated. For example, if there are three categories, you would use two dummy variables, and the category left out is implied if the other two are 0. In the color example, if Color_Red and Color_Green are both 0, it implies that the color is Blue.
Dummy variables enable the inclusion of categorical data in various types of models, such as linear regression, logistic regression, and others, allowing these models to capture the impact of categorical factors on the outcome variable.
Shannon-Wiener entropy
The Shannon-Wiener entropy, often referred to simply as Shannon entropy, is a measure of the uncertainty or randomness in a set of outcomes, and it's a fundamental concept in information theory. It was introduced by Claude Shannon in his seminal 1948 paper, "A Mathematical Theory of Communication," where he laid the groundwork for the digital communication theory. The concept is widely used in various fields, including telecommunications, computer science, and ecology, to quantify the information contained in messages or the diversity of ecological communities.
The Shannon entropy (H) of a discrete random variable X with possible values and probability mass function is defined as:
Where:
- is the probability(or frequence in actual calculation) of occurrence of the outcome.
- is the logarithm to the base (b). The base of the logarithm determines the unit of entropy. Commonly, base 2 is used, which measures entropy in bits, but base (e) (natural logarithm) and base 10 are also used in various contexts.
In essence, Shannon entropy gives us a way to calculate how much "surprise" or uncertainty is associated with a random variable's possible outcomes. Higher entropy means that the outcomes are more unpredictable and the information content is higher, while lower entropy indicates more predictability and less information.
In the context of ecology, for example, the Shannon-Wiener index is used to measure biodiversity. It considers not only the number of species (richness) but also the evenness of the species' abundances. A higher Shannon-Wiener index indicates a more diverse and balanced ecosystem, whereas a lower index suggests less diversity or greater imbalance in species distribution.